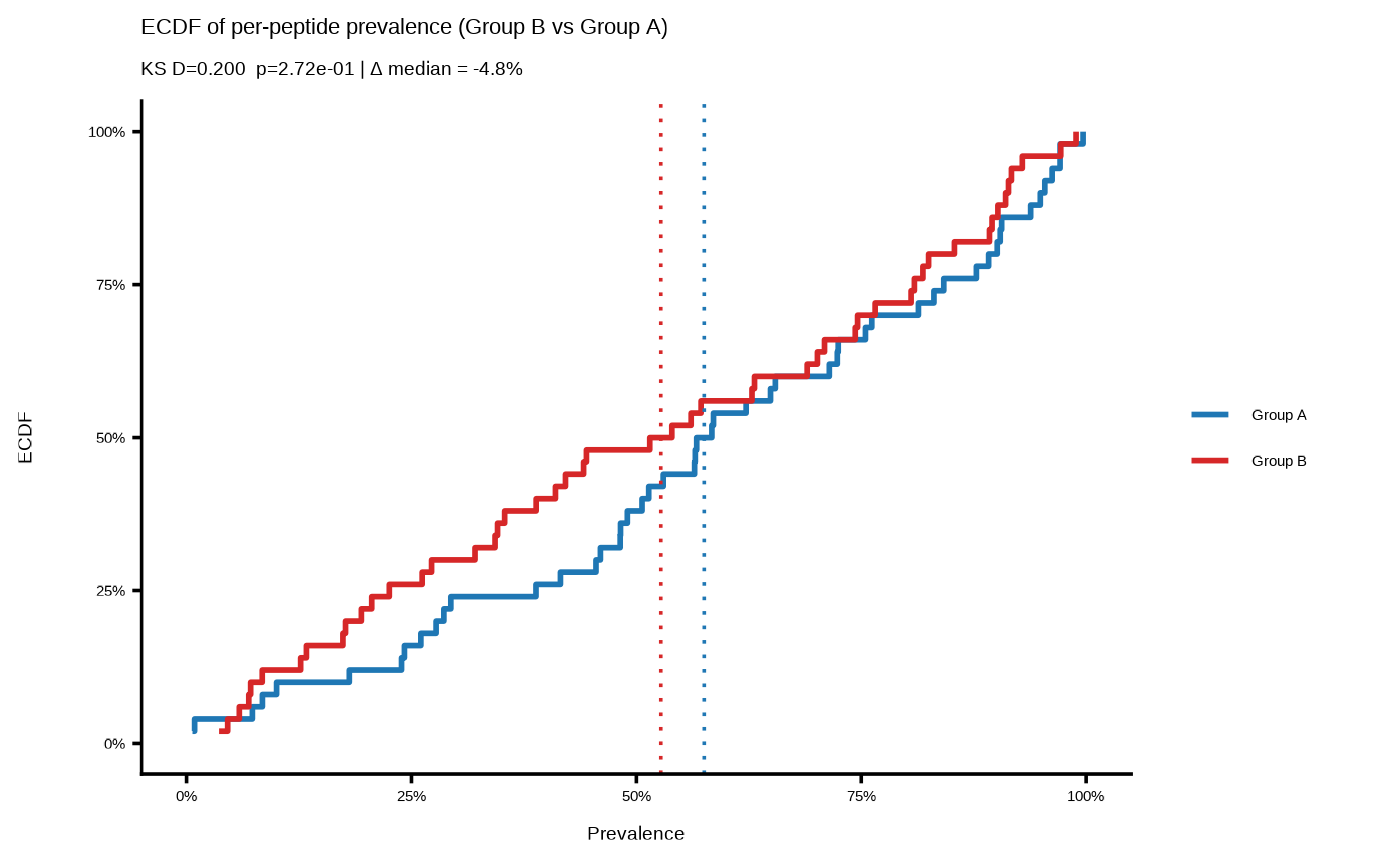
Plot empirical cumulative distribution functions (ECDFs) of
per-peptide prevalence for two groups using a
ph_compute_prevalence()-style table. The plot compares the cumulative
distribution of prevalence values between the two groups and optionally
annotates median shifts and a Kolmogorov-Smirnov (KS) test summary.
Usage
ecdf_plot(
  prev_tbl,
  group_pair_values = NULL,
  group_labels = NULL,
  line_width_pt = 1,
  line_alpha = 1,
  group1_line_color = "#1f77b4",
  group2_line_color = "#d62728",
  show_median_lines = TRUE,
  show_ks_test = TRUE,
  plot_title = NULL,
  plot_subtitle = NULL,
  x_label = NULL,
  y_label = NULL
)
Arguments
- prev_tbl
Data frame with columns
group1,group2,prop1,prop2. Optionalfeaturecolumns are ignored.- group_pair_values
Optional length-2 character vector
c(group1,
group2)
. Use this whenprev_tblcontains multiple group pairs.- group_labels
Optional length-2 character vector of display labels
c(label_group1, label_group2). Defaults togroup1/group2.- line_width_pt
Line width for ECDF steps (ggplot units). Default 1.0.
- line_alpha
Line alpha for ECDF steps. Default 1.0.
- group1_line_color, group2_line_color
Line colors for group1 and group2.
- show_median_lines
Logical; add median lines. Default
TRUE.- show_ks_test
Logical; add KS test summary to subtitle. Default
TRUE.- plot_title, plot_subtitle
Optional plot labels.
- x_label, y_label
Optional axis labels.